12 Logical vectors
12.1 Introduction
在本章中,您将学习与逻辑向量(logical vectors)合作的工具。 逻辑向量是最简单的向量类型,因为每个元素只能是三个可能的值之一:TRUE, FALSE, NA。 在原始数据中找到逻辑向量相对较少,但是在几乎所有分析过程中,您都会创建并操纵它们。
我们将首先讨论创建逻辑向量的最常见方法:使用数字比较。 然后,您将了解如何使用布尔代数组合不同的逻辑向量以及一些有用的摘要。 我们将使用 if_else() 和 case_when() 结束,这是两个有用的函数,用于进行由逻辑向量提供动力的有条件更改。
12.1.1 Prerequisites
您将在本章中学习的大多数功能由 base R 提供,因此我们不需要 tidyverse,但是我们仍然会加载它,因此我们可以使用 mutate(),filter(),等来处理数据框架。 我们还将继续从 nycflights13::flights 数据集中绘制示例。
但是,随着我们开始涵盖更多工具,并不总是有一个完美的真实示例。 因此,我们将开始使用 c() 来构成一些虚拟数据:
x <- c(1, 2, 3, 5, 7, 11, 13)
x * 2
#> [1]  2  4  6 10 14 22 26
这使解释单个函数更容易,但代价是更难看出它如何应用于你的数据问题。 请记住,我们对自由向量的任何操作,都可以通过 mutate() 等函数对数据框中的变量进行操作。
12.2 Comparisons
创建逻辑向量的一种非常常见的方法是通过数字比较 <, <=, >, >=, !=, ==。 到目前为止,我们主要在 filter() 中瞬时创建了逻辑变量 — 它们被计算,使用,然后丢弃。 例如,下面的 filter 找出所有白天出发且基本准点到达的航班:
flights |>
  filter(dep_time > 600 & dep_time < 2000 & abs(arr_delay) < 20)
#> # A tibble: 172,286 × 19
#>    year month   day dep_time sched_dep_time dep_delay arr_time sched_arr_time
#>   <int> <int> <int>    <int>          <int>     <dbl>    <int>          <int>
#> 1  2013     1     1      601            600         1      844            850
#> 2  2013     1     1      602            610        -8      812            820
#> 3  2013     1     1      602            605        -3      821            805
#> 4  2013     1     1      606            610        -4      858            910
#> 5  2013     1     1      606            610        -4      837            845
#> 6  2013     1     1      607            607         0      858            915
#> # ℹ 172,280 more rows
#> # ℹ 11 more variables: arr_delay <dbl>, carrier <chr>, flight <int>, …
知道这是一个快捷方式很有用,你也可以用 mutate() 显式创建底层的逻辑变量:
flights |>
  mutate(
    daytime = dep_time > 600 & dep_time < 2000,
    approx_ontime = abs(arr_delay) < 20,
    .keep = "used"
  )
#> # A tibble: 336,776 × 4
#>   dep_time arr_delay daytime approx_ontime
#>      <int>     <dbl> <lgl>   <lgl>
#> 1      517        11 FALSE   TRUE
#> 2      533        20 FALSE   FALSE
#> 3      542        33 FALSE   FALSE
#> 4      544       -18 FALSE   TRUE
#> 5      554       -25 FALSE   FALSE
#> 6      554        12 FALSE   TRUE
#> # ℹ 336,770 more rows
这在处理更复杂的逻辑时尤为有用,因为命名中间步骤能让代码更易读,也便于检查每一步的计算是否正确。
总的来说,最初的筛选条件等价于:
12.2.1 Floating point comparison
当心使用 == 与数字。 例如,看起来这个向量包含数字 1 和 2:
但是,如果您测试它们是否相等,则会得到 FALSE:
x == c(1, 2)
#> [1] FALSE FALSE
怎么回事? 计算机以固定小数位数存储数字,因此无法精确表示 1/49 或 sqrt(2),后续计算会出现极微小的误差。 我们可以查看实际存储的精确值,通过调用 print() 并设置 digits1 参数:
print(x, digits = 16)
#> [1] 0.9999999999999999 2.0000000000000004
你就能明白为什么 R 默认会舍入这些数字;它们确实非常接近你的预期值。
既然知道了 == 失败的原因,该如何解决呢? 一种方法是使用 dplyr::near(),它会忽略微小的差异:
12.2.2 Missing values
缺少值代表未知数,因此它们具有“传染性”:几乎所有涉及未知值的操作也将是未知的:
NA > 5
#> [1] NA
10 == NA
#> [1] NA
最令人困惑的结果是:
NA == NA
#> [1] NA
若我们稍加补充背景信息,就更容易理解为何如此:
# We don't know how old Mary is
age_mary <- NA

# We don't know how old John is
age_john <- NA

# Are Mary and John the same age?
age_mary == age_john
#> [1] NA
# We don't know!
因此若想筛选所有 dep_time 为缺失值的航班,以下代码无法奏效,因为 dep_time == NA 会在每一行都返回 NA,而 filter() 会自动剔除缺失值:
flights |>
  filter(dep_time == NA)
#> # A tibble: 0 × 19
#> # ℹ 19 variables: year <int>, month <int>, day <int>, dep_time <int>,
#> # sched_dep_time <int>, dep_delay <dbl>, arr_time <int>, …相反,我们需要一个新工具:is.na()。
12.2.3 is.na()
is.na(x) 适用于任何类型的向量,对缺失值返回 TRUE,其他情况返回 FALSE:
我们可以用 is.na() 查找所有 dep_time 缺失的行:
flights |>
  filter(is.na(dep_time))
#> # A tibble: 8,255 × 19
#>    year month   day dep_time sched_dep_time dep_delay arr_time sched_arr_time
#>   <int> <int> <int>    <int>          <int>     <dbl>    <int>          <int>
#> 1  2013     1     1       NA           1630        NA       NA           1815
#> 2  2013     1     1       NA           1935        NA       NA           2240
#> 3  2013     1     1       NA           1500        NA       NA           1825
#> 4  2013     1     1       NA            600        NA       NA            901
#> 5  2013     1     2       NA           1540        NA       NA           1747
#> 6  2013     1     2       NA           1620        NA       NA           1746
#> # ℹ 8,249 more rows
#> # ℹ 11 more variables: arr_delay <dbl>, carrier <chr>, flight <int>, …
is.na() 在 arrange() 中也很有用。 arrange() 通常将缺失值排在末尾,但通过先按 is.na() 排序可覆盖这一默认行为:
flights |>
  filter(month == 1, day == 1) |>
  arrange(dep_time)
#> # A tibble: 842 × 19
#>    year month   day dep_time sched_dep_time dep_delay arr_time sched_arr_time
#>   <int> <int> <int>    <int>          <int>     <dbl>    <int>          <int>
#> 1  2013     1     1      517            515         2      830            819
#> 2  2013     1     1      533            529         4      850            830
#> 3  2013     1     1      542            540         2      923            850
#> 4  2013     1     1      544            545        -1     1004           1022
#> 5  2013     1     1      554            600        -6      812            837
#> 6  2013     1     1      554            558        -4      740            728
#> # ℹ 836 more rows
#> # ℹ 11 more variables: arr_delay <dbl>, carrier <chr>, flight <int>, …

flights |>
  filter(month == 1, day == 1) |>
  arrange(desc(is.na(dep_time)), dep_time)
#> # A tibble: 842 × 19
#>    year month   day dep_time sched_dep_time dep_delay arr_time sched_arr_time
#>   <int> <int> <int>    <int>          <int>     <dbl>    <int>          <int>
#> 1  2013     1     1       NA           1630        NA       NA           1815
#> 2  2013     1     1       NA           1935        NA       NA           2240
#> 3  2013     1     1       NA           1500        NA       NA           1825
#> 4  2013     1     1       NA            600        NA       NA            901
#> 5  2013     1     1      517            515         2      830            819
#> 6  2013     1     1      533            529         4      850            830
#> # ℹ 836 more rows
#> # ℹ 11 more variables: arr_delay <dbl>, carrier <chr>, flight <int>, …
我们将在 Chapter 18 中回来更深入地探讨缺失值。
12.2.4 Exercises
-
dplyr::near()是如何工作的?输入near查看源代码。sqrt(2)^2接近 2 吗? - 结合使用
mutate()、is.na()和count()来描述dep_time、sched_dep_time和dep_delay中缺失值的关联情况。
12.3 Boolean algebra
当存在多个逻辑向量时,可以使用布尔代数进行组合运算。 在 R 中,& 表示 “and”,| 表示 “or”,! 表示 “not”,xor() 表示 “exclusive or”2。 例如,df |> filter(!is.na(x)) 会筛选出 x 值非缺失的所有行,而 df |> filter(x < -10 | x > 0) 会筛选出 x 值小于 -10 或大于 0 的所有行。 Figure 12.1 完整展示了布尔运算的规则及其运作原理。
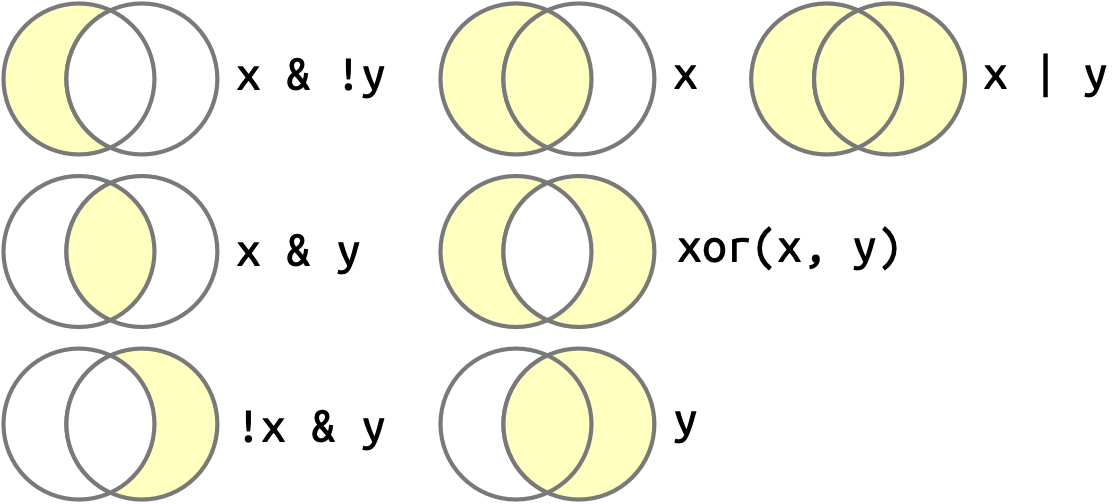
x 代表左侧圆圈,y 代表右侧圆圈,阴影区域显示各运算符选择的部分。
除了 & 和 | 外,R 还有 && 和 ||。 不要在 dplyr 函数中使用它们! 这些是短路运算符,只会返回单个 TRUE 或 FALSE。 它们对编程很重要,但对数据科学并不适用。
12.3.1 Missing values
布尔代数中缺失值的规则解释起来有些棘手,因为乍看之下似乎不太一致:
要理解其中的逻辑,可以思考 NA | TRUE(NA 或 TRUE)的情况。 逻辑向量中的缺失值表示该值可能是 TRUE 或 FALSE。 由于 TRUE | TRUE 和 FALSE | TRUE 的结果都是 TRUE,因为至少有一个为真。 NA | TRUE 也必定是 TRUE,因为无论 NA 代表 TRUE 还是 FALSE,结果都为 TRUE。 然而,NA | FALSE 会返回 NA,因为我们无法确定 NA 是 TRUE 还是 FALSE。 类似的逻辑也适用于 NA & FALSE 的情况。
12.3.2 Order of operations
需要注意的是,运算顺序与英语表达习惯不同。 请看以下查找 11 月或 12 月起飞航班的代码:
flights |>
   filter(month == 11 | month == 12)
你可能会想按照英语表达习惯写成:“查找所有 11 月或 12 月起飞的航班”:
flights |>
   filter(month == 11 | 12)
#> # A tibble: 336,776 × 19
#>    year month   day dep_time sched_dep_time dep_delay arr_time sched_arr_time
#>   <int> <int> <int>    <int>          <int>     <dbl>    <int>          <int>
#> 1  2013     1     1      517            515         2      830            819
#> 2  2013     1     1      533            529         4      850            830
#> 3  2013     1     1      542            540         2      923            850
#> 4  2013     1     1      544            545        -1     1004           1022
#> 5  2013     1     1      554            600        -6      812            837
#> 6  2013     1     1      554            558        -4      740            728
#> # ℹ 336,770 more rows
#> # ℹ 11 more variables: arr_delay <dbl>, carrier <chr>, flight <int>, …
这段代码虽然不会报错,但似乎并未达到预期效果。 原因是什么? 在这里,R 会首先计算 month == 11 生成逻辑向量,我们称为 nov。 然后执行 nov | 12。 当数值与逻辑运算符结合时,除 0 外的所有数值都会被转换为 TRUE,因此实际等价于 nov | TRUE,这个表达式永远返回 TRUE,最终会导致所有行都被选中:
flights |>
  mutate(
    nov = month == 11,
    final = nov | 12,
    .keep = "used"
  )
#> # A tibble: 336,776 × 3
#>   month nov   final
#>   <int> <lgl> <lgl>
#> 1     1 FALSE TRUE
#> 2     1 FALSE TRUE
#> 3     1 FALSE TRUE
#> 4     1 FALSE TRUE
#> 5     1 FALSE TRUE
#> 6     1 FALSE TRUE
#> # ℹ 336,770 more rows
12.3.3 %in%
避免混淆 == 和 | 运算顺序的简单方法是使用%in%。 x %in% y 会生成一个与 x 等长的逻辑向量,当 x 中的值出现在 y 中时,对应位置返回 TRUE。
因此要查找 11 月和 12 月的所有航班,我们可以这样写:
需要注意的是,%in%对 NA 的处理规则与 == 不同,因为 NA %in% NA 会返回 TRUE。
这可以成为一个实用的快捷方式:
flights |>
  filter(dep_time %in% c(NA, 0800))
#> # A tibble: 8,803 × 19
#>    year month   day dep_time sched_dep_time dep_delay arr_time sched_arr_time
#>   <int> <int> <int>    <int>          <int>     <dbl>    <int>          <int>
#> 1  2013     1     1      800            800         0     1022           1014
#> 2  2013     1     1      800            810       -10      949            955
#> 3  2013     1     1       NA           1630        NA       NA           1815
#> 4  2013     1     1       NA           1935        NA       NA           2240
#> 5  2013     1     1       NA           1500        NA       NA           1825
#> 6  2013     1     1       NA            600        NA       NA            901
#> # ℹ 8,797 more rows
#> # ℹ 11 more variables: arr_delay <dbl>, carrier <chr>, flight <int>, …
12.3.4 Exercises
- 查找所有
arr_delay缺失但dep_delay未缺失的航班。查找所有arr_time和sched_arr_time均未缺失,但arr_delay缺失的航班。 - 有多少航班的
dep_time缺失?这些行中还有哪些变量缺失?这些行可能代表什么情况? - 假设
dep_time缺失意味着航班被取消,查看每天取消航班的数量。是否存在某种规律?取消航班的比例与未取消航班的平均延误时间之间是否存在关联?
12.4 Summaries
以下部分将介绍几种用于汇总逻辑向量的实用技巧。 除了专门针对逻辑向量的函数外,您也可以使用适用于数值向量的函数。
12.4.1 Logical summaries
逻辑向量主要有两种汇总方式:any() 和 all()。 any(x) 相当于 |,只要 x 中存在任意 TRUE 就会返回 TRUE。 all(x) 相当于 &,只有当 x 中所有值都为 TRUE 时才会返回 TRUE。 与所有汇总函数一样,若存在缺失值它们会返回 NA,而通过设置 na.rm = TRUE 可忽略缺失值。
例如,我们可以用 all() 和 any() 判断是否所有航班的起飞延误都不超过一小时,或者是否存在到达延误五小时以上的航班。 结合 group_by() 还能实现按日统计:
flights |>
  group_by(year, month, day) |>
  summarize(
    all_delayed = all(dep_delay <= 60, na.rm = TRUE),
    any_long_delay = any(arr_delay >= 300, na.rm = TRUE),
    .groups = "drop"
  )
#> # A tibble: 365 × 5
#>    year month   day all_delayed any_long_delay
#>   <int> <int> <int> <lgl>       <lgl>
#> 1  2013     1     1 FALSE       TRUE
#> 2  2013     1     2 FALSE       TRUE
#> 3  2013     1     3 FALSE       FALSE
#> 4  2013     1     4 FALSE       FALSE
#> 5  2013     1     5 FALSE       TRUE
#> 6  2013     1     6 FALSE       FALSE
#> # ℹ 359 more rows不过在大多数情况下,any() 和 all() 显得过于笼统,我们往往需要更详细地了解 TRUE 和 FALSE 的具体数量。 这就引出了数值型汇总方法。
12.4.2 Numeric summaries of logical vectors
当在数值型语境中使用逻辑向量时,TRUE 会转换为 1,FALSE 会转换为 0。 这使得 sum() 和 mean() 在处理逻辑向量时特别有用:sum(x) 给出 TRUE 的数量,而 mean(x) 则给出 TRUE 的比例(因为 mean() 就是 sum() 除以 length())。
例如,通过这种方式,我们可以计算起飞延误不超过一小时的航班比例,以及到达延误五小时以上的航班数量:
flights |>
  group_by(year, month, day) |>
  summarize(
    all_delayed = mean(dep_delay <= 60, na.rm = TRUE),
    any_long_delay = sum(arr_delay >= 300, na.rm = TRUE),
    .groups = "drop"
  )
#> # A tibble: 365 × 5
#>    year month   day all_delayed any_long_delay
#>   <int> <int> <int>       <dbl>          <int>
#> 1  2013     1     1       0.939              3
#> 2  2013     1     2       0.914              3
#> 3  2013     1     3       0.941              0
#> 4  2013     1     4       0.953              0
#> 5  2013     1     5       0.964              1
#> 6  2013     1     6       0.959              0
#> # ℹ 359 more rows
12.4.3 Logical subsetting
逻辑向量在数据汇总中还有一个最终用途:您可以使用逻辑向量对单个变量进行子集筛选,从而聚焦感兴趣的数据子集。 这里需要用到基础的 [(称为”子集”)操作符,Section 27.2 将对此进行更详细的讲解。
假设我们只想分析实际发生延误的航班的平均延误时间。 一种实现方法是先筛选出延误航班,再计算平均延误:
flights |>
  filter(arr_delay > 0) |>
  group_by(year, month, day) |>
  summarize(
    behind = mean(arr_delay),
    n = n(),
    .groups = "drop"
  )
#> # A tibble: 365 × 5
#>    year month   day behind     n
#>   <int> <int> <int>  <dbl> <int>
#> 1  2013     1     1   32.5   461
#> 2  2013     1     2   32.0   535
#> 3  2013     1     3   27.7   460
#> 4  2013     1     4   28.3   297
#> 5  2013     1     5   22.6   238
#> 6  2013     1     6   24.4   381
#> # ℹ 359 more rows
这种方法虽然可行,但如果我们还想计算提前抵达航班的平均延误时间呢? 那就需要额外执行一次筛选步骤,再想办法合并两个数据框3。 其实您可以直接使用 [ 进行内联筛选:arr_delay[arr_delay > 0] 将仅返回正的到达延误值。
由此可得:
flights |>
  group_by(year, month, day) |>
  summarize(
    behind = mean(arr_delay[arr_delay > 0], na.rm = TRUE),
    ahead = mean(arr_delay[arr_delay < 0], na.rm = TRUE),
    n = n(),
    .groups = "drop"
  )
#> # A tibble: 365 × 6
#>    year month   day behind ahead     n
#>   <int> <int> <int>  <dbl> <dbl> <int>
#> 1  2013     1     1   32.5 -12.5   842
#> 2  2013     1     2   32.0 -14.3   943
#> 3  2013     1     3   27.7 -18.2   914
#> 4  2013     1     4   28.3 -17.0   915
#> 5  2013     1     5   22.6 -14.0   720
#> 6  2013     1     6   24.4 -13.6   832
#> # ℹ 359 more rows12.4.4 Exercises
12.5 Conditional transformations
逻辑向量最强大的功能之一是用于条件转换,即对满足条件 x 的情况执行一种操作,对满足条件 y 的情况执行另一种操作。 这需要用到两个重要函数:if_else() 和 case_when()。
12.5.1 if_else()
当需要为 TRUE 条件返回一个值,为 FALSE 条件返回另一个值时,可以使用 dplyr::if_else()4。 if_else() 前三个参数是必须的。 第一个参数 condition 是逻辑向量;第二个参数 true 指定条件为真时的返回值;第三个参数 false 指定条件为假时的返回值。
从一个简单示例开始,我们将数字向量标记为”+ve”(正数)或”-ve”(负数):
还有一个可选的第四个参数,missing 用于处理输入为 NA 的情况:
if_else(x > 0, "+ve", "-ve", "???")
#> [1] "-ve" "-ve" "-ve" "-ve" "+ve" "+ve" "+ve" "???"
你还可以为 true 和 false 参数使用向量。 例如,这样可以创建一个最小化的 abs() 实现:
if_else(x < 0, -x, x)
#> [1]  3  2  1  0  1  2  3 NA
目前所有参数都使用了相同的向量,但你当然可以混合搭配。 例如,可以实现一个简单版的 coalesce() 如下:
你可能已经注意到我们上面的标签示例有一个小问题:零既不是正数也不是负数。 我们可以通过增加一个额外的 if_else() 来解决这个问题:
这样的代码已经开始变得难以阅读,若条件增多会更加混乱。 此时可以改用 dplyr::case_when()。
12.5.2 case_when()
dplyr 的 case_when() 借鉴了 SQL 的 CASE 语句,能够灵活地为不同条件执行不同运算。 其特殊语法与 tidyverse 其他函数风格迥异。 它采用 condition ~ output 的配对形式。 condition 必须是逻辑向量;当为 TRUE 时,对应的 output 就会被采用。
通过这种方式,我们可以重构之前嵌套的 if_else() 代码如下:
虽然代码量增加了,但表达更加清晰明确。
为了说明 case_when() 的工作原理,我们先看几个简单例子。 当所有条件都不匹配时,输出结果会返回 NA:
case_when(
  x < 0 ~ "-ve",
  x > 0 ~ "+ve"
)
#> [1] "-ve" "-ve" "-ve" NA    "+ve" "+ve" "+ve" NA
如果想设置默认值/兜底选项,可在左侧使用 TRUE:
case_when(
  x < 0 ~ "-ve",
  x > 0 ~ "+ve",
  TRUE ~ "???"
)
#> [1] "-ve" "-ve" "-ve" "???" "+ve" "+ve" "+ve" "???"
需注意,若多个条件同时匹配,只会采用第一个匹配项:
case_when(
  x > 0 ~ "+ve",
  x > 2 ~ "big"
)
#> [1] NA    NA    NA    NA    "+ve" "+ve" "+ve" NA
与 if_else() 类似,你可以在 ~ 两侧使用变量,并根据问题需要自由组合变量。 例如,我们可以用 case_when() 为到达延误生成更易懂的标签:
flights |>
  mutate(
    status = case_when(
      is.na(arr_delay)      ~ "cancelled",
      arr_delay < -30       ~ "very early",
      arr_delay < -15       ~ "early",
      abs(arr_delay) <= 15  ~ "on time",
      arr_delay < 60        ~ "late",
      arr_delay < Inf       ~ "very late",
    ),
    .keep = "used"
  )
#> # A tibble: 336,776 × 2
#>   arr_delay status
#>       <dbl> <chr>
#> 1        11 on time
#> 2        20 late
#> 3        33 late
#> 4       -18 early
#> 5       -25 early
#> 6        12 on time
#> # ℹ 336,770 more rows
编写这类复杂的 case_when() 语句时需要格外谨慎;我最开始两次尝试混用了 < 和 > 运算符,结果不小心创建了相互重叠的条件判断。
12.5.3 Compatible types
请注意,if_else() 和 case_when() 都要求输出值的类型必须兼容。 如果类型不兼容,就会出现如下错误提示:
总体而言,兼容的类型相对较少,因为自动转换向量类型常会导致错误。 以下是几种最重要的兼容情况:
- 数值型与逻辑型向量兼容,如 Section 12.4.2 所述。
- 字符串与因子兼容(Chapter 16),因为因子本质是具有限定取值范围的字符串
- Dates 与 date-times,我们将在 Chapter 17 讨论,因为 date 是 date-time 的特殊形式
-
NA,技术上属于逻辑向量,与所有类型兼容,因为所有向量都有表示缺失值的方式。
这些规则无需死记硬背,随着对 tidyverse 的持续使用会自然掌握,因为它们在整套工具中保持高度一致性。
12.5.4 Exercises
判断一个数是否为偶数可通过
x %% 2 == 0实现。 请用此方法结合if_else()判断 0 到 20 之间每个数字的奇偶性。给定日期向量如
x <- c("Monday", "Saturday", "Wednesday"),使用ifelse()标注周末或工作日。用
ifelse()计算数值向量x的绝对值。编写
case_when()语句,根据flights数据集的month和day列标注美国主要节日(如元旦、独立日、感恩节、圣诞节)。 先创建逻辑列,TRUE或FALSE,再创建字符列,节日名称或NA。
12.6 Summary
逻辑向量的定义很简单,因为每个值只能是 TRUE、FALSE 或 NA。 但逻辑向量却蕴含着巨大能量。 本章我们学习了如何用 >, <, <=, =>, ==, !=, is.na() 创建逻辑向量,如何用 !, &, | 进行组合运算,以及如何用 any(), all(), sum(), mean() 进行汇总。 你还掌握了能根据逻辑向量返回不同值的强大函数 if_else() 和 case_when()。
后续章节我们会反复见到逻辑向量。 例如在 Chapter 14 你将学习 str_detect(x, pattern),它会对 x 中符合模式的元素返回 TRUE,在 Chapter 17 你将通过日期时间比较生成逻辑向量。 但现在,我们将转向另一种重要向量类型:数值向量。
R 通常会自动调用 print 函数(即,
x相当于print(x)的简写),但如果你想传入其他参数,显式调用会更方便。↩︎也就是说,当 x 为 true 或 y 为 true,但不同时为 true 时,
xor(x, y)返回 true。 这正符合我们日常英语中使用 “or” 的方式。 “Both” 通常不是一个可接受的回答,对于”您想要冰淇淋还是蛋糕?“这个问题。↩︎我们将在 Chapter 19 中详细讲解这一点。↩︎
dplyr 的
if_else()与 base R 的ifelse()非常相似。if_else()相比ifelse()有两大优势:可以自定义缺失值的处理方式,且在变量类型不兼容时更可能给出有意义的错误提示。↩︎