6 Dynamic UI
到目前为止,我们已经看到用户界面和 server 函数之间的清晰分离:用户界面是在 app 启动时静态定义的,因此它无法响应 app 中发生的任何情况。 在本章中,您将学习如何创建动态(dynamic)用户界面,使用在 server 函数中运行的代码更改 UI。
创建动态用户界面有以下三种关键技术:
使用
update系列函数修改输入控件的参数。使用
tabsetPanel()有条件地显示和隐藏部分用户界面。使用
uiOutput()和renderUI()通过代码生成用户界面的选定部分。
这三个工具使您能够通过修改输入和输出来响应用户。 我将演示一些更有用的方法来应用它们,但最终您只会受到创造力的限制。 同时,这些工具可能会使您的 app 更加难以推理,因此请谨慎部署它们,并始终努力使用最简单的技术来解决您的问题。
6.1 Updating inputs
我们将从一种简单的技术开始,该技术允许您在创建输入后对其进行修改:更新函数系列。
每个输入控件,例如 textInput() 与更新函数配对,例如 updateTextInput(),允许您在创建控件后对其进行修改。
以下面代码为例,结果如 Figure 6.1 所示。
该 app 有两个输入,用于控制另一个输入(滑块)的范围(min 和 max)。
关键思想是每当 min 或 max 输入发生变化时,使用 observeEvent()20 触发 updateSliderInput()。
ui <- fluidPage(
  numericInput("min", "Minimum", 0),
  numericInput("max", "Maximum", 3),
  sliderInput("n", "n", min = 0, max = 3, value = 1)
)
server <- function(input, output, session) {
  observeEvent(input$min, {
    updateSliderInput(inputId = "n", min = input$min)
  })
  observeEvent(input$max, {
    updateSliderInput(inputId = "n", max = input$max)
  })
}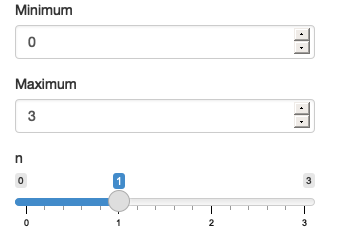
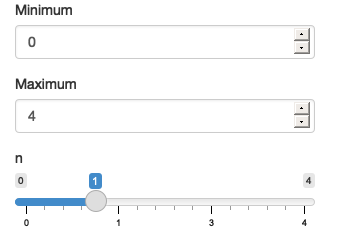
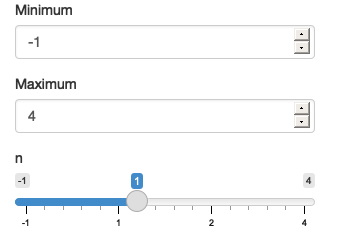
Figure 6.1: 加载时的 app(左),增加 max(中),然后减少 min(右)。 See live at https://hadley.shinyapps.io/ms-update-basics.
更新函数看起来与其他 Shiny 函数略有不同:它们都将输入的名称(作为字符串)作为 inputId 参数21。
其余参数对应于输入构造函数的参数,可以在创建后进行修改。
为了帮助您掌握更新函数,我将展示几个更简单的示例,然后我们将使用分层选择框深入研究更复杂的案例,最后讨论循环引用问题。
6.1.1 Simple uses
更新函数最简单的用途是为用户提供一些小便利。
例如,也许您希望能够轻松地将参数重置回其初始值。
下面的代码片段展示了如何组合 actionButton()、observeEvent() 和 updateSliderInput(),输出如 Figure 6.2 所示。
ui <- fluidPage(
  sliderInput("x1", "x1", 0, min = -10, max = 10),
  sliderInput("x2", "x2", 0, min = -10, max = 10),
  sliderInput("x3", "x3", 0, min = -10, max = 10),
  actionButton("reset", "Reset")
)

server <- function(input, output, session) {
  observeEvent(input$reset, {
    updateSliderInput(inputId = "x1", value = 0)
    updateSliderInput(inputId = "x2", value = 0)
    updateSliderInput(inputId = "x3", value = 0)
  })
}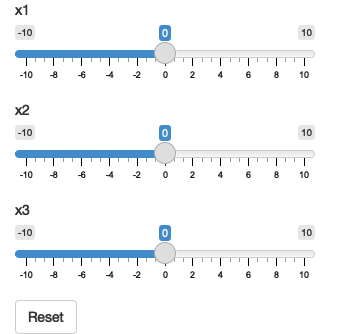
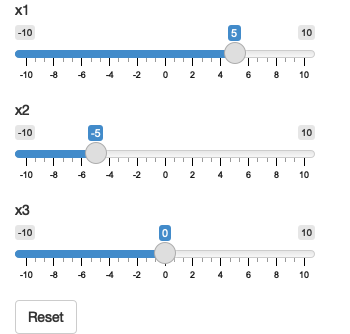

Figure 6.2: 加载 app(左),拖动一些滑块后(中),后然后单击 reset(右)。 See live at https://hadley.shinyapps.io/ms-update-reset.
类似的应用程序是调整操作按钮的文本,以便您确切地知道它将做什么。 Figure 6.3 显示了下面代码的结果。
ui <- fluidPage(
  numericInput("n", "Simulations", 10),
  actionButton("simulate", "Simulate")
)

server <- function(input, output, session) {
  observeEvent(input$n, {
    label <- paste0("Simulate ", input$n, " times")
    updateActionButton(inputId = "simulate", label = label)
  })
}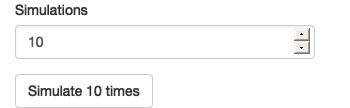
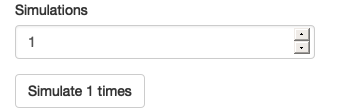
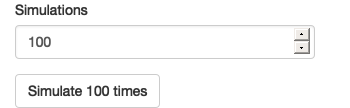
Figure 6.3: 加载时的 app(左),将 simulations 设置为 1(中),然后将 simulations 设置为 100(右)。 See live at https://hadley.shinyapps.io/ms-update-button.
以这种方式使用更新函数的方法有很多种;当您开发复杂的应用程序时,请寻找向用户提供更多信息的方法。 一个特别重要的应用是通过逐步过滤,可以更轻松地从一长串可能的选项中进行选择。 这通常是“分层选择框”的问题。
6.1.2 Hierarchical select boxes
更新函数的一个更复杂但特别有用的应用是允许跨多个类别进行交互式钻取。 我将使用来自 https://www.kaggle.com/kyanyoga/sample-sales-data 的销售仪表盘的一些虚构数据来说明它们的用法。
sales <- vroom::vroom("sales-dashboard/sales_data_sample.csv", col_types = list(), na = "")
sales %>%
  select(TERRITORY, CUSTOMERNAME, ORDERNUMBER, everything()) %>%
  arrange(ORDERNUMBER)
#> # A tibble: 2,823 × 25
#>    TERRITORY CUSTOMERNAME   ORDERNUMBER QUANTITYORDERED PRICEEACH ORDERLINENUMBER
#>    <chr>     <chr>                <dbl>           <dbl>     <dbl>           <dbl>
#>  1 NA        Online Diecas…       10100              30     100                 3
#>  2 NA        Online Diecas…       10100              50      67.8               2
#>  3 NA        Online Diecas…       10100              22      86.5               4
#>  4 NA        Online Diecas…       10100              49      34.5               1
#>  5 EMEA      Blauer See Au…       10101              25     100                 4
#>  6 EMEA      Blauer See Au…       10101              26     100                 1
#>  7 EMEA      Blauer See Au…       10101              45      31.2               3
#>  8 EMEA      Blauer See Au…       10101              46      53.8               2
#>  9 NA        Vitachrome In…       10102              39     100                 2
#> 10 NA        Vitachrome In…       10102              41      50.1               1
#> # ℹ 2,813 more rows
#> # ℹ 19 more variables: SALES <dbl>, ORDERDATE <chr>, STATUS <chr>, QTR_ID <dbl>,
#> #   MONTH_ID <dbl>, YEAR_ID <dbl>, PRODUCTLINE <chr>, MSRP <dbl>,
#> #   PRODUCTCODE <chr>, PHONE <chr>, ADDRESSLINE1 <chr>, ADDRESSLINE2 <chr>,
#> #   CITY <chr>, STATE <chr>, POSTALCODE <chr>, COUNTRY <chr>,
#> #   CONTACTLASTNAME <chr>, CONTACTFIRSTNAME <chr>, DEALSIZE <chr>
在这个演示中,我将重点关注数据中的自然层次结构:
- 每个 territory 都包含 customers。
- 每个 customer 有多个 orders。
- 每个 order 包含多行。
我想创建一个用户界面,您可以:
- 选择一个 territory 以查看所有 customers。
- 选择一个 customer 以查看所有 orders。
- 选择一个 order 以查看基础行。
UI 的本质很简单:我将创建三个选择框和一个输出表。
customername 和 ordernumber 选择框的选项将动态生成,因此我设置 choices = NULL。
ui <- fluidPage(
  selectInput("territory", "Territory", choices = unique(sales$TERRITORY)),
  selectInput("customername", "Customer", choices = NULL),
  selectInput("ordernumber", "Order number", choices = NULL),
  tableOutput("data")
)
在 server 函数中,我自上而下地工作:
我创建了一个响应式
territory(),其中包含与来自sales所选 territory 匹配的行。每当
territory()发生变化时,我都会更新input$customername选择框中的choices列表。我创建了另一个响应式
customer(),其中包含与来自territory()所选 customer 匹配的行。每当
customer()更改时,我都会更新input$ordernumber选择框中的choices列表。我在
output$data中显示选定的 orders。
您可以在下面看到该组织:
server <- function(input, output, session) {
  territory <- reactive({
    filter(sales, TERRITORY == input$territory)
  })
  observeEvent(territory(), {
    choices <- unique(territory()$CUSTOMERNAME)
    updateSelectInput(inputId = "customername", choices = choices)
  })

  customer <- reactive({
    req(input$customername)
    filter(territory(), CUSTOMERNAME == input$customername)
  })
  observeEvent(customer(), {
    choices <- unique(customer()$ORDERNUMBER)
    updateSelectInput(inputId = "ordernumber", choices = choices)
  })

  output$data <- renderTable({
    req(input$ordernumber)
    customer() %>%
      filter(ORDERNUMBER == input$ordernumber) %>%
      select(QUANTITYORDERED, PRICEEACH, PRODUCTCODE)
  })
}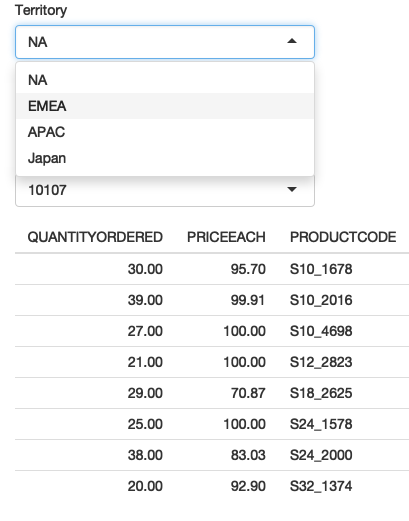
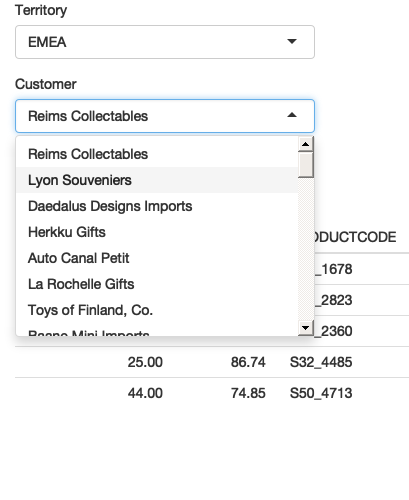
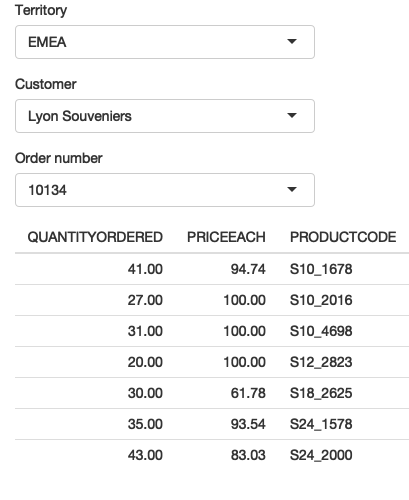
Figure 6.4: 我选择 “EMEA”(左),然后选择 “Lyon Souveniers”(中),然后(右)查看 orders。 See live at https://hadley.shinyapps.io/ms-update-nested.
在 https://hadley.shinyapps.io/ms-update-nested 尝试这个简单的示例,或者在 https://github.com/hadley/mastering-shiny/tree/master/sales-dashboard 查看更完整的应用程序仪表盘。
6.1.3 Freezing reactive inputs
有时,这种分层选择可能会短暂地创建一组无效的输入,从而导致出现不希望的输出。 例如,考虑这个简单的 app,您可以在其中选择数据集,然后选择要汇总的变量:
ui <- fluidPage(
  selectInput("dataset", "Choose a dataset", c("pressure", "cars")),
  selectInput("column", "Choose column", character(0)),
  verbatimTextOutput("summary")
)

server <- function(input, output, session) {
  dataset <- reactive(get(input$dataset, "package:datasets"))

  observeEvent(input$dataset, {
    updateSelectInput(inputId = "column", choices = names(dataset()))
  })

  output$summary <- renderPrint({
    summary(dataset()[[input$column]])
  })
}
如果您尝试 https://hadley.shinyapps.io/ms-freeze 上的实时 app,您会注意到当您切换数据集时,摘要输出会短暂闪烁。
这是因为 updateSelectInput() 仅在所有输出和观察者运行后才产生影响,因此暂时存在一种状态,其中具有数据集 B 和数据集 A 中的变量,因此输出包含 summary(NULL)。
您可以通过使用 freezeReactiveValue() “冻结(freezing)”输入来解决此问题。
这确保了使用输入的任何响应式或输出在下一轮完整的失效之前不会被更新22。
server <- function(input, output, session) {
  dataset <- reactive(get(input$dataset, "package:datasets"))

  observeEvent(input$dataset, {
    freezeReactiveValue(input, "column")
    updateSelectInput(inputId = "column", choices = names(dataset()))
  })

  output$summary <- renderPrint({
    summary(dataset()[[input$column]])
  })
}
请注意,无需“解冻”输入值;在 Shiny 检测到会话和 server 再次同步后,这种情况会自动发生。
您可能想知道何时应该使用 freezeReactiveValue():当您动态更改输入 value 时始终使用它实际上是一个很好的做法。
实际的修改需要一些时间才能流到浏览器,然后返回到 Shiny,在此期间,任何值的读取充其量都是浪费,最坏的情况会导致错误。
使用 freezeReactiveValue() 告诉所有下游计算输入值已过时,他们应该节省精力直到它有用为止。
6.1.4 Circular references
如果您想使用更新函数来更改输入的当前 value23,我们需要讨论一个重要问题。
从 Shiny 的角度来看,使用更新函数修改 value 与用户通过单击或键入来修改 value 没有什么不同。
这意味着更新函数可以以与人类完全相同的方式触发响应式更新。
这意味着您现在已经超出了纯响应式编程的范围,并且您需要开始担心循环引用和无限循环。
例如,采用以下简单的 app。
它包含一个输入控件和一个将其值加一的观察者。
每次 updateNumericInput() 运行时,它都会更改 input$n,导致 updateNumericInput() 再次运行,因此 app 陷入无限循环,不断增加 input$n 的值。
ui <- fluidPage(
  numericInput("n", "n", 0)
)
server <- function(input, output, session) {
  observeEvent(input$n,
               updateNumericInput(inputId = "n", value = input$n + 1)
  )
}
您不太可能在自己的 app 中产生如此明显的问题,但如果您更新彼此依赖的多个控件,则可能会出现这种问题,如下一个示例所示。
6.1.6 Exercises
- 使用更新
input$date的 server 函数完成下面的用户界面,以便您只能选择input$year中的日期。
ui <- fluidPage(
  numericInput("year", "year", value = 2020),
  dateInput("date", "date")
)- 使用 server 函数完成下面的用户界面,该函数根据
input$state更新input$county选择。 对于额外的挑战,还可以将 Louisiana 的标签从 “County” 更改为 “Parish”,将 Alaska 的标签从 “County” 更改为 “Borough”。
library(openintro, warn.conflicts = FALSE)
#> Loading required package: airports
#> Loading required package: cherryblossom
#> Loading required package: usdata
#> Registered S3 methods overwritten by 'readr':
#>   method                    from
#>   as.data.frame.spec_tbl_df vroom
#>   as_tibble.spec_tbl_df     vroom
#>   format.col_spec           vroom
#>   print.col_spec            vroom
#>   print.collector           vroom
#>   print.date_names          vroom
#>   print.locale              vroom
#>   str.col_spec              vroom
states <- unique(county$state)

ui <- fluidPage(
  selectInput("state", "State", choices = states),
  selectInput("county", "County", choices = NULL)
)- 使用 server 函数完成下面的用户界面,该函数根据
input$continent更新input$country选择。 使用output$data显示所有匹配的行。
library(gapminder)
continents <- unique(gapminder$continent)

ui <- fluidPage(
  selectInput("continent", "Continent", choices = continents),
  selectInput("country", "Country", choices = NULL),
  tableOutput("data")
)
扩展之前的 app,以便您还可以选择所有 continents,从而查看所有 countries。 您需要将
"(All)"添加到选项列表中,然后在过滤时特殊处理。https://community.rstudio.com/t/29307 所描述问题的核心是什么 ?
6.2 Dynamic visibility
复杂性的下一步是有选择地显示和隐藏部分 UI。 如果您了解一点 JavaScript 和 CSS,还有更复杂的方法,但有一种不需要任何额外知识的有用技术:使用选项卡集隐藏可选 UI(如 Section ?? 中介绍的)。 这是一个聪明的技巧,允许您根据需要显示和隐藏 UI,而无需从头开始重新生成它(正如您将在下一节中学到的)。
ui <- fluidPage(
  sidebarLayout(
    sidebarPanel(
      selectInput("controller", "Show", choices = paste0("panel", 1:3))
    ),
    mainPanel(
      tabsetPanel(
        id = "switcher",
        type = "hidden",
        tabPanelBody("panel1", "Panel 1 content"),
        tabPanelBody("panel2", "Panel 2 content"),
        tabPanelBody("panel3", "Panel 3 content")
      )
    )
  )
)

server <- function(input, output, session) {
  observeEvent(input$controller, {
    updateTabsetPanel(inputId = "switcher", selected = input$controller)
  })
}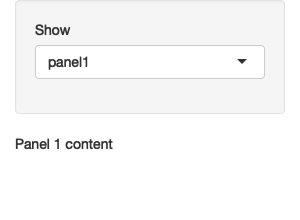

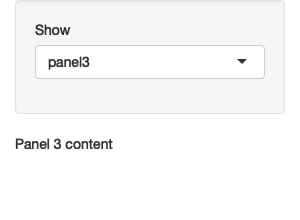
Figure 6.5: 选择 panel1(左),然后选择 panel2(中),然后选择 panel3(右)。 See live at https://hadley.shinyapps.io/ms-dynamic-panels.
这里有两个主要想法:
- 使用带有隐藏选项卡的选项卡集面板。
- 使用
updateTabsetPanel()从 server 切换选项卡。
这是一个简单的想法,但是当与一点创造力相结合时,它会给你带来相当大的力量。 以下两节介绍了如何在实践中使用它的几个小示例。
6.2.1 Conditional UI
想象一下,您想要一个允许用户模拟正态分布、均匀分布和指数分布的 app。
每个分布都有不同的参数,因此我们需要某种方法来显示不同分布的不同控件。
在这里,我将把每个发行版的唯一用户界面放在自己的 tabPanel() 中,然后将三个选项卡排列到一个 tabsetPanel() 中。
parameter_tabs <- tabsetPanel(
  id = "params",
  type = "hidden",
  tabPanel("normal",
           numericInput("mean", "mean", value = 1),
           numericInput("sd", "standard deviation", min = 0, value = 1)
  ),
  tabPanel("uniform",
           numericInput("min", "min", value = 0),
           numericInput("max", "max", value = 1)
  ),
  tabPanel("exponential",
           numericInput("rate", "rate", value = 1, min = 0),
  )
)
然后,我将其嵌入到更完整的 UI 中,该 UI 允许用户选择样本数量并显示结果的直方图:
ui <- fluidPage(
  sidebarLayout(
    sidebarPanel(
      selectInput("dist", "Distribution",
        choices = c("normal", "uniform", "exponential")
      ),
      numericInput("n", "Number of samples", value = 100),
      parameter_tabs,
    ),
    mainPanel(
      plotOutput("hist")
    )
  )
)
请注意,我已经仔细地将 input$dist 中的 choices 与选项卡面板的名称进行了匹配。
这使得编写下面的 observeEvent() 代码变得很容易,该代码可以在分布发生变化时自动切换控件。
该 app 的其余部分使用您已经熟悉的技术。
最终结果如 Figure 6.6 所示。
server <- function(input, output, session) {
  observeEvent(input$dist, {
    updateTabsetPanel(inputId = "params", selected = input$dist)
  })

  sample <- reactive({
    switch(input$dist,
      normal = rnorm(input$n, input$mean, input$sd),
      uniform = runif(input$n, input$min, input$max),
      exponential = rexp(input$n, input$rate)
    )
  })
  output$hist <- renderPlot(hist(sample()), res = 96)
}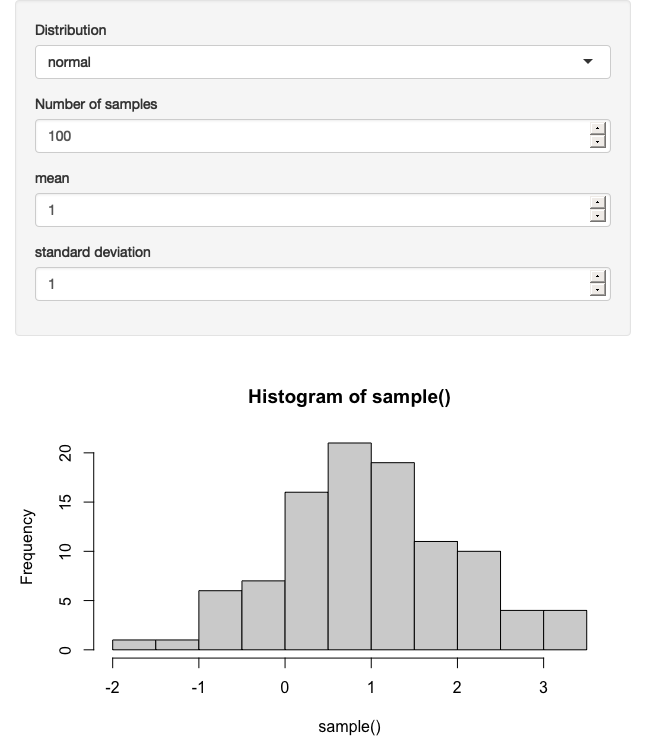
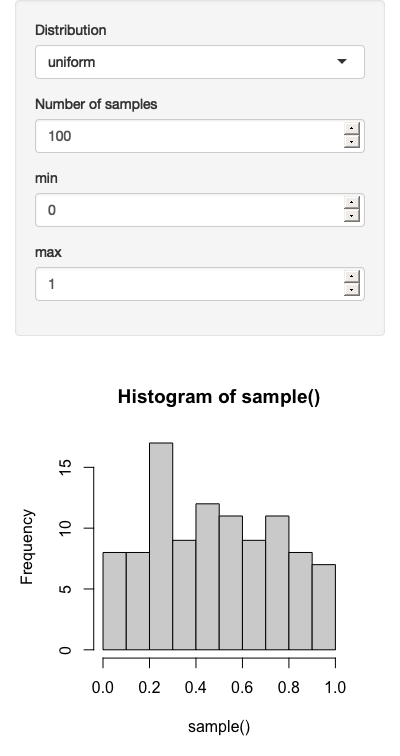
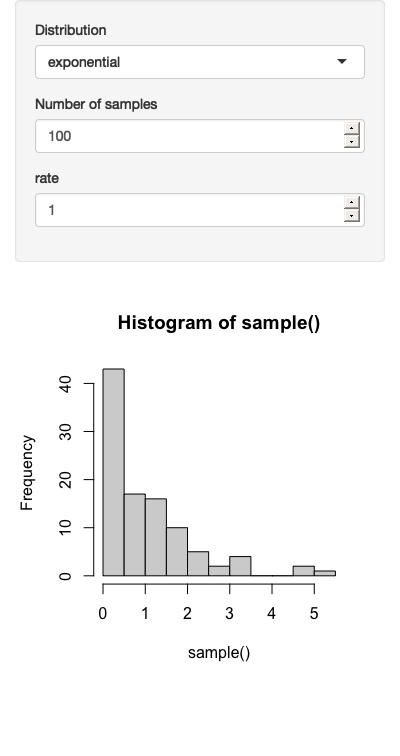
Figure 6.6: 正态分布(左)、均匀分布(中)和指数分布(右)的结果。 See live at https://hadley.shinyapps.io/ms-dynamic-conditional.
请注意,(例如)input$mean 的值与其对用户是否可见无关。
底层的 HTML 控件仍然存在;你只是看不到它。
6.2.2 Wizard interface
您还可以使用这个想法来创建一个“向导(wizard)”,这是一种界面,可以通过将大量信息分布在多个页面上来更轻松地收集信息。 在这里,我们在每个“页面”中嵌入了操作按钮,以便轻松前进和后退。 结果如 Figure 6.7 所示。
ui <- fluidPage(
  tabsetPanel(
    id = "wizard",
    type = "hidden",
    tabPanel("page_1",
             "Welcome!",
             actionButton("page_12", "next")
    ),
    tabPanel("page_2",
             "Only one page to go",
             actionButton("page_21", "prev"),
             actionButton("page_23", "next")
    ),
    tabPanel("page_3",
             "You're done!",
             actionButton("page_32", "prev")
    )
  )
)

server <- function(input, output, session) {
  switch_page <- function(i) {
    updateTabsetPanel(inputId = "wizard", selected = paste0("page_", i))
  }

  observeEvent(input$page_12, switch_page(2))
  observeEvent(input$page_21, switch_page(1))
  observeEvent(input$page_23, switch_page(3))
  observeEvent(input$page_32, switch_page(2))
}


Figure 6.7: 向导界面将复杂的 UI 划分为多个页面。在这里,我们通过一个非常简单的示例来演示这个想法,单击 next 前进到下一页。 See live at https://hadley.shinyapps.io/ms-wizard.
请注意使用 switch_page() 函数来减少 server 代码中的重复量。
我们将在 Chapter ?? 中回到这个想法,然后在 Section ?? 中创建一个模块来自动化向导界面。
6.2.3 Exercises
- 仅当用户选中 “advanced” 复选框时,才使用隐藏选项卡集显示其他控件。
- 创建一个绘制
ggplot(diamonds, aes(carat))的 app,但允许用户选择要使用的 geom:geom_histogram()、geom_freqpoly()或geom_density()。 使用隐藏选项卡集允许用户根据 geom 选择不同的参数:geom_histogram()和geom_freqpoly()有一个 binwidth 参数;geom_density()有一个bw参数。 - 修改您在上一个练习中创建的 app,以允许用户选择是否显示每个 geom(即,他们可以选择 0、1、2 或 3,而不是始终使用一个 geom)。确保您可以独立控制 histogram 和 frequency polygon 的 binwidth。
6.3 Creating UI with code
有时,上述技术都无法为您提供所需的动态级别:更新函数仅允许您更改现有输入,而选项卡集仅在您拥有一组固定且已知的可能组合时才起作用。 有时,您需要根据其他输入创建不同类型或数量的输入(或输出)。 最后一项技术使您能够做到这一点。
值得注意的是,您始终使用代码创建用户界面,但到目前为止您总是在 app 启动之前完成。 此技术使您能够在 app 运行时创建和修改用户界面。 该解决方案有两个部分:
uiOutput()在您的ui中插入一个占位符。 这会留下一个“空位(hole)”,您的 server 代码可以稍后填充。renderUI()在server()中调用,用动态生成的 UI 填充占位符。
我们将通过一个简单的示例来了解它是如何工作的,然后深入研究一些实际用途。
6.3.1 Getting started
让我们从一个简单的 app 开始,该 app 动态创建一个输入控件,并通过其他两个输入来控制类型和标签。 生成的 app 如 Figure 6.8 所示。
ui <- fluidPage(
  textInput("label", "label"),
  selectInput("type", "type", c("slider", "numeric")),
  uiOutput("numeric")
)
server <- function(input, output, session) {
  output$numeric <- renderUI({
    if (input$type == "slider") {
      sliderInput("dynamic", input$label, value = 0, min = 0, max = 10)
    } else {
      numericInput("dynamic", input$label, value = 0, min = 0, max = 10)
    }
  })
}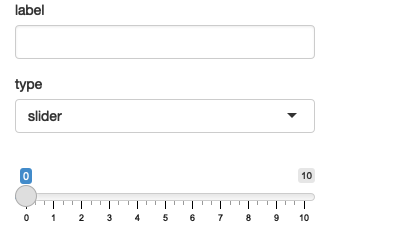
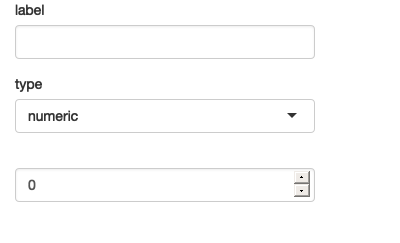
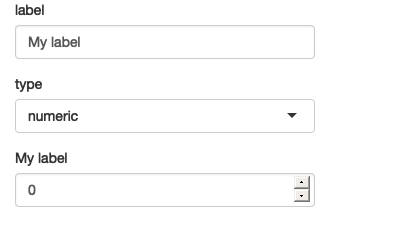
Figure 6.8: 加载 app(左),然后将类型更改为数字(中),然后将标签更改为 ‘my label’。 See live at https://hadley.shinyapps.io/ms-render-simple.
如果您自己运行此代码,您会注意到 app 加载后需要不到一秒的时间才会出现。
这是因为它是响应式的:app 必须加载、触发响应式事件,该事件调用 server 函数,生成要插入到页面中的 HTML。
这是 renderUI() 的缺点之一;过度依赖它可能会导致用户界面滞后。
为了获得良好的性能,请使用本章前面描述的技术尽可能多地保持用户界面的固定。
这种方法还有另一个问题:当您更改控件时,您会丢失当前选择的值。 维护现有状态是使用代码创建 UI 的一大挑战。 这就是有选择地显示和隐藏 UI 是一种更好的方法(如果它适合您)的原因之一 — 因为您没有销毁和重新创建控件,因此不需要执行任何操作来保留值。 但是,在许多情况下,我们可以通过将新输入的值设置为现有控件的当前值来解决问题:
server <- function(input, output, session) {
  output$numeric <- renderUI({
    value <- isolate(input$dynamic)
    if (input$type == "slider") {
      sliderInput("dynamic", input$label, value = value, min = 0, max = 10)
    } else {
      numericInput("dynamic", input$label, value = value, min = 0, max = 10)
    }
  })
}
isolate() 的使用很重要。
我们将回到它在 Section ?? 中的作用,但这里它确保我们不会创建响应式依赖关系,这会导致每次 input$dynamic 更改时重新运行此代码(每当用户修改值时就会发生这种情况)。我们只希望它在 input$type 或 input$label 更改时更改。
6.3.2 Multiple controls
当您生成任意数量或类型的控件时,动态 UI 最有用。
这意味着您将使用代码生成 UI,我建议使用函数式编程来完成此类任务。
在这里,我将使用 purrr::map() 和 purrr::reduce(),但您当然可以对基本 lapply() 和 Reduce() 函数执行相同的操作。
如果您不熟悉函数式编程的 map() 和 reduce(),您可能需要在继续之前先阅读一下 Functional programming。
我们还将在 Chapter ?? 中回到这个想法。
这些都是复杂的想法,所以如果您第一次阅读时没有理解,请不要紧张。
为了具体说明这一点,假设您希望用户能够提供他们自己的调色板。
他们首先会指定需要多少种颜色,然后为每种颜色提供一个值。
ui 非常简单:我们有一个 numericInput() 来控制输入数量,一个 uiOutput() 用来生成生成的文本框,还有一个 textOutput() 来证明我们已经将所有内容正确地组合在一起。
ui <- fluidPage(
  numericInput("n", "Number of colours", value = 5, min = 1),
  uiOutput("col"),
  textOutput("palette")
)
server 函数很短,但包含一些重要的想法:
server <- function(input, output, session) {
  col_names <- reactive(paste0("col", seq_len(input$n)))

  output$col <- renderUI({
    map(col_names(), ~ textInput(.x, NULL))
  })

  output$palette <- renderText({
    map_chr(col_names(), ~ input[[.x]] %||% "")
  })
}
我使用响应式
col_names()来存储我将要生成的每个颜色输入的名称。然后,我使用
map()创建一个textInput()列表,每个文本输入对应col_names()中的每个名称。renderUI()然后获取此 HTML 组件列表并将其添加到 UI。我需要使用一种新技巧来访问输入值的值。 到目前为止,我们总是使用
$访问输入的组成部分,例如input$col1。 但这里我们有字符向量中的输入名称,例如var <- "col1"。$在这种情况下不再起作用,因此我们需要切换到[[,即input[[var]]。我使用
map_chr()将所有值收集到字符向量中,并将其显示在output$palette中。 不幸的是,在浏览器渲染新输入之前,有一段短暂的时间,它们的值为NULL。 这会导致map_chr()出错,我们通过使用方便的%||%函数来修复该错误:只要左侧为NULL,它就会返回右侧。
您可以在 Figure 6.9 中看到结果。
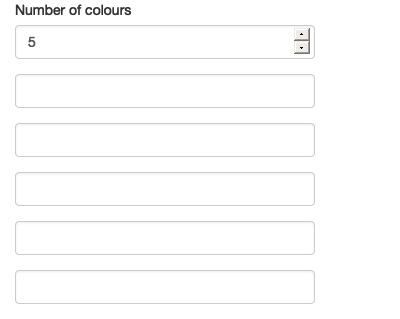
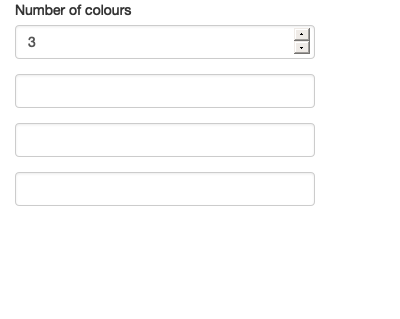
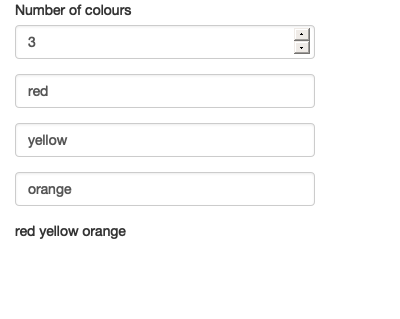
Figure 6.9: 加载时的 app(左),将 n 设置为 3(中),然后输入一些颜色(右)。 See live at https://hadley.shinyapps.io/ms-render-palette.
如果您运行此 app,您会发现一个非常烦人的行为:每当您更改颜色数量时,您输入的所有数据都会消失。
我们可以使用与之前相同的技术来解决此问题:将 value 设置为(isolated)当前值。
我还将调整外观,使其看起来更好一些,包括在绘图中显示选定的颜色。
示例屏幕截图如 Figure 6.10 所示。
ui <- fluidPage(
  sidebarLayout(
    sidebarPanel(
      numericInput("n", "Number of colours", value = 5, min = 1),
      uiOutput("col"),
    ),
    mainPanel(
      plotOutput("plot")
    )
  )
)

server <- function(input, output, session) {
  col_names <- reactive(paste0("col", seq_len(input$n)))

  output$col <- renderUI({
    map(col_names(), ~ textInput(.x, NULL, value = isolate(input[[.x]])))
  })

  output$plot <- renderPlot({
    cols <- map_chr(col_names(), ~ input[[.x]] %||% "")
    # convert empty inputs to transparent
    cols[cols == ""] <- NA

    barplot(
      rep(1, length(cols)),
      col = cols,
      space = 0,
      axes = FALSE
    )
  }, res = 96)
}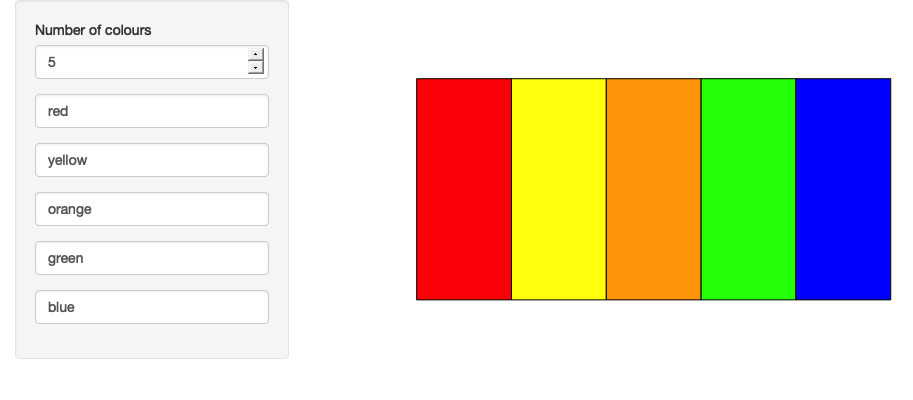
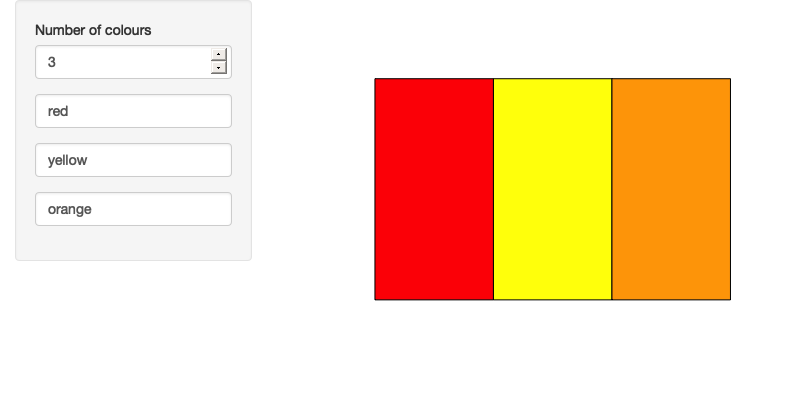
Figure 6.10: 填充彩虹颜色(左),然后将颜色数量减少到 3(右);请注意,现有颜色将被保留。 See live at https://hadley.shinyapps.io/ms-render-palette-full.
6.3.3 Dynamic filtering
为了结束本章,我将创建一个 app,让您可以动态过滤任何数据框。 每个数字变量将获得一个范围滑块,每个因子变量将获得多项选择,因此(例如)如果数据框具有三个数字变量和两个因子,则 app 将具有三个滑块和两个选择框。
我将从一个为单个变量创建 UI 的函数开始。 它将返回数字输入的范围滑块、因子输入的多重选择以及所有其他类型的 NULL(无)。
make_ui <- function(x, var) {
  if (is.numeric(x)) {
    rng <- range(x, na.rm = TRUE)
    sliderInput(var, var, min = rng[1], max = rng[2], value = rng)
  } else if (is.factor(x)) {
    levs <- levels(x)
    selectInput(var, var, choices = levs, selected = levs, multiple = TRUE)
  } else {
    # Not supported
    NULL
  }
}
然后,我将编写与此函数等效的 server 端:它接受输入控件的变量和值,并返回一个逻辑向量,说明是否包含每个观察结果。 使用逻辑向量可以轻松组合多个列的结果。
filter_var <- function(x, val) {
  if (is.numeric(x)) {
    !is.na(x) & x >= val[1] & x <= val[2]
  } else if (is.factor(x)) {
    x %in% val
  } else {
    # No control, so don't filter
TRUE
}
}
然后,我可以“手动”使用这些函数为 iris 数据集生成一个简单的过滤 UI:
ui <- fluidPage(
  sidebarLayout(
    sidebarPanel(
      make_ui(iris$Sepal.Length, "Sepal.Length"),
      make_ui(iris$Sepal.Width, "Sepal.Width"),
      make_ui(iris$Species, "Species")
    ),
    mainPanel(
      tableOutput("data")
    )
  )
)
server <- function(input, output, session) {
  selected <- reactive({
    filter_var(iris$Sepal.Length, input$Sepal.Length) &
      filter_var(iris$Sepal.Width, input$Sepal.Width) &
      filter_var(iris$Species, input$Species)
  })

  output$data <- renderTable(head(iris[selected(), ], 12))
}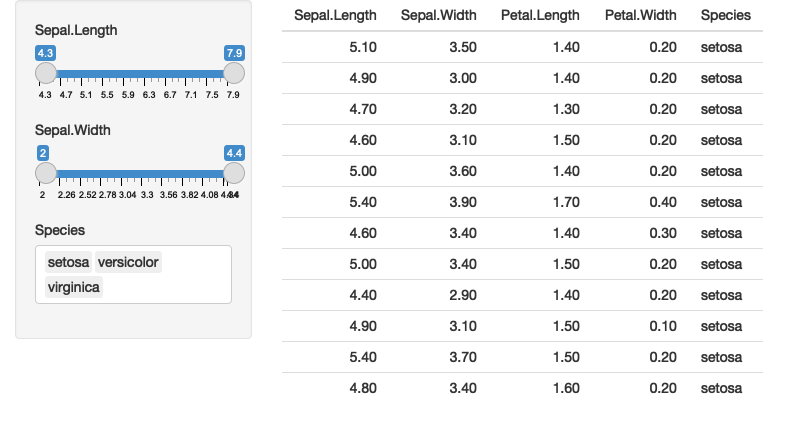
Figure 6.11: iris 数据集的简单过滤器接口
您可能会注意到,我厌倦了复制和粘贴,因此该 app 仅适用于三列。 我可以通过使用一些函数式编程使其适用于所有列:
在
ui中使用map()为每个变量生成一个控件。在
server()中,我使用map()为每个变量生成选择向量。 然后,我使用reduce()获取每个变量的逻辑向量,并通过将每个向量组合成一个逻辑向量。
再次强调,如果您不完全了解这里发生的情况,请不要太担心。 主要的收获是,一旦掌握了函数式编程,您就可以编写非常简洁的代码来生成复杂的动态 apps。
ui <- fluidPage(
  sidebarLayout(
    sidebarPanel(
      map(names(iris), ~ make_ui(iris[[.x]], .x))
    ),
    mainPanel(
      tableOutput("data")
    )
  )
)
server <- function(input, output, session) {
  selected <- reactive({
    each_var <- map(names(iris), ~ filter_var(iris[[.x]], input[[.x]]))
    reduce(each_var, ~ .x & .y)
  })

  output$data <- renderTable(head(iris[selected(), ], 12))
}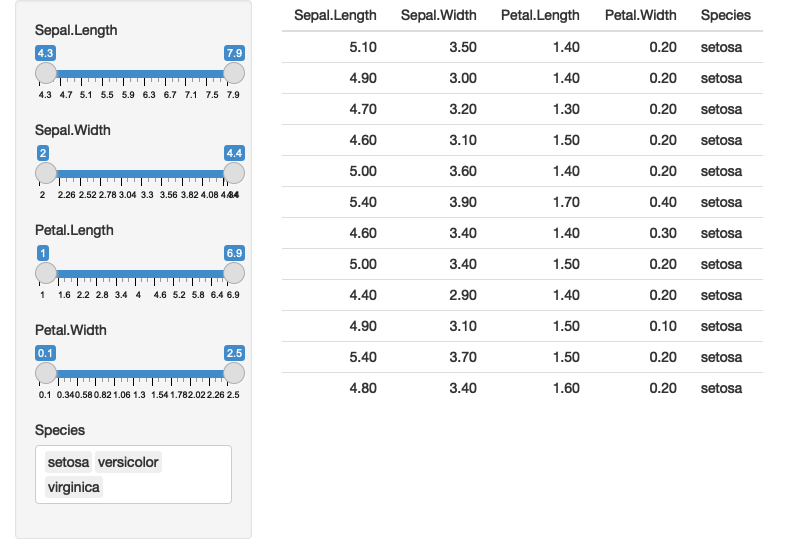
Figure 6.12: 使用函数式编程为 iris 数据集构建过滤 app。
从这里开始,这是一个适用于任何数据框的简单概括。 在这里,我将使用数据集包中的数据框来说明它,但是您可以轻松想象如何将其扩展到用户上传的数据。 结果如 Figure 6.13 所示。
dfs <- keep(ls("package:datasets"), ~ is.data.frame(get(.x, "package:datasets")))

ui <- fluidPage(
  sidebarLayout(
    sidebarPanel(
      selectInput("dataset", label = "Dataset", choices = dfs),
      uiOutput("filter")
    ),
    mainPanel(
      tableOutput("data")
    )
  )
)
server <- function(input, output, session) {
  data <- reactive({
    get(input$dataset, "package:datasets")
  })
  vars <- reactive(names(data()))

  output$filter <- renderUI(
    map(vars(), ~ make_ui(data()[[.x]], .x))
  )

  selected <- reactive({
    each_var <- map(vars(), ~ filter_var(data()[[.x]], input[[.x]]))
    reduce(each_var, `&`)
  })

  output$data <- renderTable(head(data()[selected(), ], 12))
}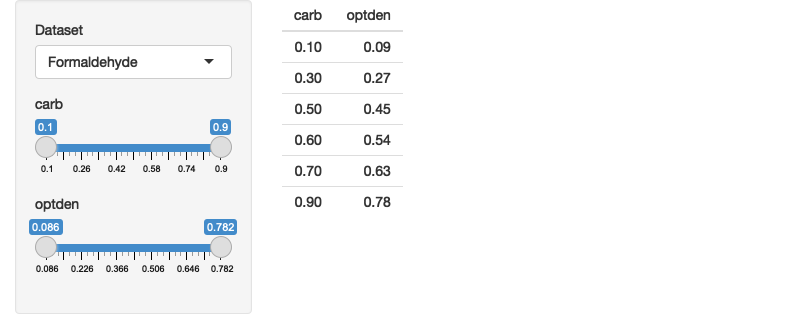
Figure 6.13: 根据所选数据集的字段自动生成的动态用户界面。 See live at https://hadley.shinyapps.io/ms-filtering-final.
6.3.4 Dialog boxes
在我们结束之前,想提一下相关的技术:对话框。
您已经在 Section ?? 中看到了它们,其中对话框的内容是固定的文本字符串。
但由于 modalDialog() 是从 server 函数内部调用的,因此您实际上可以以与 renderUI() 相同的方式动态生成内容。
如果您想迫使用户在继续常规应用程序流程之前做出某些决定,那么这是一项非常有用的技术。
6.3.5 Exercises
- 根据本节中的初始示例采用这个非常简单的 app:
ui <- fluidPage(
  selectInput("type", "type", c("slider", "numeric")),
  uiOutput("numeric")
)
server <- function(input, output, session) {
  output$numeric <- renderUI({
    if (input$type == "slider") {
      sliderInput("n", "n", value = 0, min = 0, max = 100)
    } else {
      numericInput("n", "n", value = 0, min = 0, max = 100)
    }
  })
}
您如何使用动态可见性来实现它? 如果您实现动态可见性,那么当您更改控件时如何保持值同步?
- 解释一下这个 app 是如何工作的。 为什么当您第二次单击输入密码按钮时密码消失了?
ui <- fluidPage(
  actionButton("go", "Enter password"),
  textOutput("text")
)
server <- function(input, output, session) {
  observeEvent(input$go, {
    showModal(modalDialog(
      passwordInput("password", NULL),
      title = "Please enter your password"
    ))
  })

  output$text <- renderText({
    if (!isTruthy(input$password)) {
      "No password"
    } else {
      "Password entered"
    }
  })
}6.4 Summary
在阅读本章之前,您只能在运行 server 函数之前静态创建用户界面。 现在您已经学习了如何修改用户界面并完全重新创建它以响应用户操作。 动态用户界面将极大地增加 app 的复杂性,因此,如果您发现自己很难调试正在发生的内容,请不要感到惊讶。 始终记住使用最简单的技术来解决您的问题,然后回到 Section 5.2 中的调试建议。
下一章转向讨论书(bookmarking),使与其他人共享 app 的当前状态成为可能。